
DOWNLOAD PRESENTATIONS
All presentations at the CARRFS 1-Day Public Health 2017-Pre-Conference Symposium can be downloaded by clicking on the presentation title

Jostein Algroy

Bernard Choi

Trevor van Ingen

Douglas Dover

Ian Pike
Maritia Gully
Michael King

Céline Plante

Drona Rasali
Colin Ware

Hussain Usman

Jeremy Herring

Michelle Canac-Marquis

Amy Estill and Auburn Larose

Jat Sandhu

Bernard Choi
A Brief Overview of CARRFS
Jostein Algroy, Co-Chair, CARRFS
Perspectives on CARRFS, AMNET and WARFS
Bernard Choi, Co-Chair, CARRFS
2011 Update of the Ontario Marginalization Index
Trevor van Ingen, Public Health Ontario, Ontario
The Health Equity Measurement Framework
Douglas C. Dover, Alberta Health, Alberta
Self-reported injuries in the population (12+ years of age) of British Columbia (BC) over time from 2007/2008 to 2013/2014
Ian Pike, University of British Columbia, British Columbia
Community Health Data Tools in British Columbia
Drona Rasali, BC Centre for Disease Control, Maritia Gully, Vancouver Coastal Health Authority, British Columbia
The Rapid Risk Factor Surveillance System (RRFSS) – 16 Years of “Filling in the Gaps” to Inform Local Public Health Decision-Making
Michael King, Sudbury & District Health Unit, Ontario
Quebec Integrated Chronic Disease Surveillance System (QICDSS): Innovative approach and data dissemination strategies
Céline Plante, Institut national de santé publique du Québec (INSPQ), Quebec
The Economic Burden of Five Risk Factors for Chronic Diseases in British Columbia (BC): Excess Weight, Tobacco Smoking, Alcohol Use, Physical Inactivity and Low Fruit and Vegetable Consumption
Drona Rasali, BC Centre of Disease Control, British Columbia
Keynote Session:
Thinking with Visualizations: From Patterns to Insight
Colin Ware, Director of the Data Visualization Research Laboratory, University of New Hampshire, USA
Developing an in-house data visualization infrastructure: a game changer for surveillance and reporting in Alberta
Hussain Usman, Alberta Health Services, Alberta
Snapshots: An interactive information product to improve public health practice and decision-making
Jeremy Herring, Public Health Ontario, Ontario
Turning complex quantitative findings into accessible knowledge
Heather Gass, Michelle Canac-Marquis, Michele Boileau-Falardeau, Public Health Agency of Canada Atlantic Region, Quebec Region, and Ontario Region
Let’s Get Visual: Building capacity for data visualization at a local health unit
Auburn Larose & Amy Estill, Wellington-Dufferin-Guelph Public Health, Ontario
Closing Keynote Session:
Advancing Risk Factor Surveillance in Canada
Jat Sandhu, Data Analytics and Decision Support, Vancouver Coastal Health Authority, British Columbia
Summary of the Day & Adjourn
Bernard Choi, Co-Chair, CARRFS
Thank You!
SPONSOR Organizations:

FINAL PROGRAM
La Version française suit
DOWNLOAD PROGRAM IN ENGLISH: CLICK HERE
DOWNLOAD SPEAKERS' ROSTER IN ENGLISH: CLICK HERE
08:30 – 09:00 Registration
09:00 – 09:30 Welcome and Introduction
- CARRFS: A brief overview of CARRFS, Jostein Algroy, Co-Chair CARRFS
- CARRFS: Perspectives on CARRFS, AMNET and WARFS, Bernard Choi, Co-Chair, CARRFS
- CARRFS: Perspectives on CARRFS: Deena Hinshaw, Co-Chair, CARRFS Scientific Conference Working Group
Overview of CARRFS and Surveillance Activities in Canada
09:30 – 10:00 Equity Session
- 2011 Update to the Ontario Marginalization Index, Trevor van Ingen, Public Health Ontario, Ontario
- The Health Equity Measurement Framework, Douglas C. Dover, Alberta Health, Alberta
10:00 – 10:30 Special Topics Session
- Self-reported injuries in the population (12+ years of age) of British Columbia (BC) over time from 2007/2008 to 2013/2014. Ian Pike, University of British Columbia, British Columbia
- Community Health Data Tools in British Columbia, Drona Rasali, BC Centre for Disease Control, Maritia Gully, Vancouver Coastal Health Authority, British Columbia
10:30 – 10:45 Break
10:45 – 11:30 Risk Factors Session
- The Rapid Risk Factor Surveillance System (RRFSS) – 15 Years of “Filling in the Gaps” to Inform Local Public Health Decision-Making, Michael King, Sudbury & District Health Unit, Ontario
- Quebec Integrated Chronic Disease Surveillance System (QICDSS): Innovative approach and data dissemination strategies. Céline Plante, Institut national de santé publique du Québec (INSPQ), Quebec
- The Economic Burden of Five Risk Factors for Chronic Diseases in British Columbia (BC): Excess Weight, Tobacco Smoking, Alcohol Use, Physical Inactivity and Low Fruit and Vegetable Consumption. Drona Rasali, BC Centre of Disease Control, British Columbia
11:30 – 12:30 Lunch Break
Effective Data Visualization in Public Health: Approaches and Tools
12:30 – 13:30 Keynote Session: Thinking with Visualizations: From Patterns to Insight. Colin Ware, Director of the Data Visualization Research Laboratory, University of New Hampshire, USA
13:30 – 15:00 Canadian Case Studies: Visualization of Canadian Public Health Data: Showcase 4 Case Studies from Canadian Public Health Surveillance:
- Developing an in-house data visualization infrastructure: a game changer for surveillance and reporting in Alberta, Hussain Usman, Alberta Health Services, Alberta
- Snapshots: An interactive information product to improve public health practice and decision-making, Jeremy Herring, Public Health Ontario, Ontario
- Turning complex quantitative findings into accessible knowledge. Heather Gass, Michelle Canac-Marquis, Michele Boileau-Falardeau, Public Health Agency of Canada Atlantic Region, Quebec Region, and Ontario Region
- Let’s Get Visual: Building capacity for data visualization at a local health unit. Auburn Larose & Amy Estill, Wellington-Dufferin-Guelph Public Health, Ontario (Remote presentation).
15:00 – 15:15 Break
15:15 – 16:00 Panel Discussion: Implementation of Data Visualization in Public Health
- Colin Ware, Director of the Data Visualization Research Laboratory, University of New Hampshire, USA
- Hussain Usman, Public Heath Surveillance and Infrastructure, Alberta Health Services, Alberta
- Jeremy Herring, Public Health Ontario, Ontario
- Drona Rasali, BC Centre of Disease Control, British Columbia
- Auburn Larose & Amy Estill, Wellington-Dufferin-Guelph Public Health (Remote participation)
Risk Factor Surveillance in Canada and Closing
16:00 – 17:00 Closing Keynote Session: Advancing Risk Factor Surveillance in Canada. Jat Sandhu, Data Analytics and Decision Support, Vancouver Coastal Health Authority, British Columbia
17:00 – 17:15 Summary of the Day & Adjourn
17:30 – 20:30 CPHA Networking Dinner or on your own
Programme FINAL
Pour télécharger le programme en français: CLIQUEZ ICI
Pour voir la liste des conférenciers (en anglais): cliquez ici
Veuillez noter que toutes les présentations sont offertes en anglais seulement.
08h30 – 09h00 Enregistrement
09h00 – 09h30 Mot de bienvenue et présentations
- ACSRFR. Un bref aperçu de l’ACSRFR, Jostein Algroy, co-président
- ACSRFR. Perspectives sur l’ACSRFR, AMNET et WARFS, Bernard Choi, co-président
- ACSRFR. Perspectives sur l’ACSRFR, Deena Hinshaw, co-présidente du groupe de travail de la conférence scientifique.
Vue d'ensemble de l’ACSRFR et des activités de surveillance au Canada
09h30 – 10h00 Session sur l’équité
- Mise à jour 2011 de l'indice de marginalisation de l'Ontario, Trevor van Ingen, Public Health Ontario (ON)
- Le Cadre de mesure de l'équité en matière de santé, Douglas C. Dover, Alberta Health (AB)
10h00 – 10h30 Session sur les études
- Les blessures autodéclarées dans la population (12 ans et plus) de la Colombie-Britannique (BC) au cours du temps de 2007-2008 à 2013-2014. Ian Pike, UBC (BC)
- Outils de données sur la santé communautaire en Colombie-Britannique. Drona Rasali, BCCDC, Maritia Gully, Vancouver Coastal Health Authority (BC)
10h30 – 10h45 Pause
10h45 – 11h30 Session sur les facteurs de risque
- Le fardeau économique de cinq facteurs de risque de maladies chroniques en Colombie-Britannique (Colombie-Britannique): poids excessif, tabagisme, consommation d'alcool, inactivité physique et faible consommation de fruits et de légumes. Drona Rasali, BCCDC (BC)
- Le Système de surveillance rapide des facteurs de risque (RRFSS) - 15 ans à «combler les lacunes» pour informer les décideurs locaux de la santé publique, Michael King, Sudbury District Health (ON)
- Le Système intégré de surveillance des maladies chroniques du Québec (SISMACQ): approche novatrice et stratégies de diffusion de données, Céline Plante, INSPQ (QC)
11h30 – 12h30 Dîner
Visualisation efficace des données en santé publique: approches et outils
12h30 - 13h30 Conférencier invité
- Penser avec la visualisation: des modèles à la perspicacité. Colin Ware, directeur, Laboratoire de recherche sur la visualisation des données, Université du New Hampshire, États-Unis
13h30 – 15h00 Séance de visualisation des données sur la santé publique canadienne:
Présentation de 4 études de cas de la surveillance de la santé publique au Canada
- À déterminer, Hussain Usman, Alberta Health Services (AB)
- Snapshots: un produit d'information interactif pour améliorer la pratique de la santé publique et la prise de décision, Jeremy Herring, Santé publique Ontario (ON)
- Transformer des résultats quantitatifs complexes en connaissances accessibles. Heather Gass, Région de l'Atlantique, Michelle Canac-Marquis et Michèle Boileau-Falardeau, Région du Québec et Région de l'Ontario, Agence de la santé publique du Canada
- To be translated: Let’s Get Visual: Building capacity for data visualization at a local health unit. Auburn Larose & Amy Estill, Wellington-Dufferin-Guelph Public Health, Ontario (Remote presentation).
15h00 - 15h15 Pause
15h15 – 16h00 Discussion et séance de questions de l'auditoire: mise en œuvre de la visualisation des données en santé publique
- Colin Ware, Directeur, Laboratoire de recherche de visualisation de données, Université du New Hampshire, États-Unis
- Hussain Usman, directeur général, Santé de l'Alberta (AB)
- Jeremy Herring, Santé publique Ontario (ON)
- Drona Rasali, BCCDC (BC)
- Auburn Larose/Amy Estill, Wellington-Dufferin-Guelph Public Health, Ontario (Remote participation).
Surveillance des facteurs de risque au Canada et clôture
16h00 – 17h00 Séance d'information
- Faire progresser la surveillance des facteurs de risque au Canada. Jat Sandhu, directeur exécutif, analyse des données et soutien à la décision, Vancouver Coastal Health Authority (BC)
17h00 – 17h15 Résumé de la journée et ajournement
17h30 - 20h30 Souper de réseautage de l'ACSRFR en réseau ou souper libre
organisations commanditaire :

KEYNOTE ANNOUNCEMENT
THINKING WITH VISUALIZATIONS: FROM PATTERNS TO INSIGHT
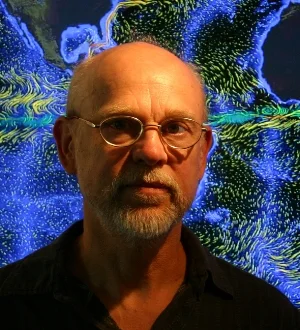
DR. COLIN WARE
DIRECTOR
DATA VISUALIZATION RESEARCH LAB, CENTER FOR COASTAL AND OCEAN MAPPING, UNIVERSITY OF NEW HAMPSHIRE, Durham, New HamPshire, USA
Dr. Ware will introduce the process of “thinking with visualizations” - going from low-level pattern perception and work up to higher level cognitive processes including working memory and the control of visual attention. Concepts will be illustrated with examples including pattern perception in weather displays, understanding the behavior of humpback whales, interaction with computer models of predator-prey interactions, and the direction of attention to support effective story telling.
Dr. Ware specializes in applying theories of perception to the design visualizations. He has advanced degrees in both computer science (M.Math, Waterloo) and in the psychology of perception (PhD, Toronto). He has published over 160 scientific articles ranging from rigorously scientific contributions to the Journal of Physiology, Behavior and Vision Research to applications-oriented articles in the fields of data visualization and human-computer interaction. His book Information Visualization: Perception for Design is now in its third edition and is a standard reference. His book, Visual Thinking for Design, is a less academic treatment of the visual thinking process applied to visualization design. Ware also likes to build practical visualization systems. Fledermaus, a commercial 3D geospatial visualization system widely used in oceanography, was developed from his initial prototypes. His trackPlot software is being used by marine mammal scientists and his flowVis2D software is serving images on NOAA websites.
PreLiminary Announcement
Description: The Canadian Alliance for Regional Risk Factor Surveillance (CARRFS) is offering a 1-Day Public Health 2017 Pre-Conference Symposium in Halifax, June 5th 2017. The day will include abstract presentations on the topic of local risk factor and health determinant surveillance as well as keynote speakers on the topic of data visualization. Building data visualization capacity is important for communicating surveillance data to policymakers and public health professionals, locally and across all provinces/territories of Canada.
The morning will be dedicated to hearing from presenters involved in developing the process and content of local surveillance systems across Canada. In the afternoon, keynote speakers will discuss cutting edge progress in methods and use of data visualization techniques, followed by discussion among participants on effective ways to produce compelling data visualization. One or more keynote presentations will be shared nationally across Canada through webcasting.
Participants will also learn more about the work of CARRFS. Established in 2008, CARRFS is a network of public health professionals interested in regional/local risk factor and health determinant surveillance in Canada. CARRFS collaborates with health agencies across jurisdictions to identify innovations, promote successful experiences, and support linkages with existing surveillance systems in order to improve their quality, visibility, and usefulness. CARRFS allows members to interact, support and exchange ideas with colleagues working on surveillance from across Canada through a social network platform, on-line tools/resources, training, and the CARRFS' annual symposium.
Learning Outcome: Participants of the CARRFS 1-Day Pre-Conference Symposium will learn ways in which they can more effectively communicate the results of data analysis to public health decision makers and the general public, including data visualization techniques and “storytelling” with data. They will also learn about various ways in which risk factor and health determinants surveillance data is being collected and used across Canada, and efforts by CARRFS to support such initiatives.
Target Audience: Epidemiologists, biostatisticians, public health professionals and students who are interested in communicating compelling stories using quantitative and/or qualitative public health data.
Public health professionals who are interested in finding more about local risk factor and health determinant surveillance, and the benefits of CARRFS membership. There is no membership fee to join CARRFS. Click here to sign up for your free membership.
Registration Fee: Participants in person or virtually must register and pay fees through Canadian Public Health Association (CPHA) Public Health 2017 Conference website - click here.
- Delegates $40 (per person, coffee breaks and lunch included)
- Students $25 (per person, coffee breaks and lunch included)
- Webinar $25 (per connection)
Further Information: Send your questions or comments here.